The glacial till and post-glacial alluvium that underpin much of the Wigan basin present a particular challenge for foundation design, with the Middle Coal Measures weathered clays showing plasticity characteristics that can vary markedly within a single borehole log. When the River Douglas floodplain deposits encounter the boulder clay of the Higher Coal Measures around Haigh, the transition zone often produces soils that a simple particle-size distribution alone cannot classify. Our laboratory team runs Atterberg limits determinations according to BS 1377-2:1990, using both the Casagrande cup method and the cone penetrometer fall-cone technique to resolve borderline cases where the liquid limit sits near 35 percent. For site investigation contractors working across the Wigan Metropolitan Borough, from the redevelopment plots near the DW Stadium to the housing allocations in Ashton-in-Makerfield, knowing the plasticity index before specifying foundation depth can prevent costly over-excavation in shrinkable clays that the test pits logging alone may underestimate. The laboratory's UKAS-accredited procedures ensure that every liquid and plastic limit result feeds directly into the ground investigation report with full traceability, supporting the geotechnical engineer's assessment of volume change potential under BS 8004 and Eurocode 7 design scenarios.
A plasticity index shift of four points in Wigan's glacial till can change the foundation design from a conventional strip footing to a suspended ground beam.
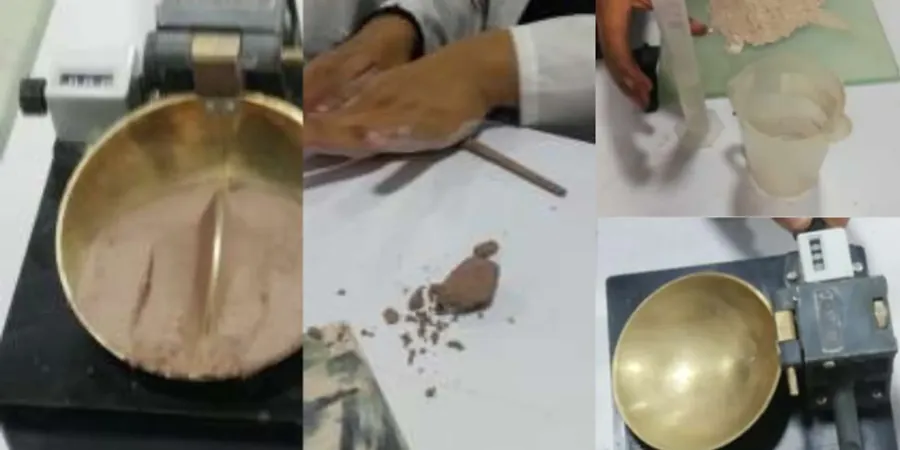
Process overview
Contrasting soil behaviour between the western and eastern sectors of Wigan highlights why Atterberg limits testing cannot be reduced to a single-number report. On the western edge near Orrell and Up Holland, the Pennine Lower Coal Measures produce silty clays of moderate plasticity that compact well but demand careful moisture conditioning during earthworks; a plastic limit varying by just three percentage points can mean the difference between acceptable compaction and a failed
Proctor tests verification. To the east, around the Leigh and Atherton corridor, the Manchester Marl and underlying drift deposits generate higher-plasticity clays with liquid limits exceeding 50 percent, where the relationship between natural water content and plastic limit becomes critical for assessing heave risk in prolonged wet weather. Our laboratory processes each sample through the full BS 1377 workflow: the liquid limit is determined using the cone penetrometer method with four-point calibration, the plastic limit by hand-rolling 3 mm threads, and the plasticity index calculated to classify the soil within the Casagrande plasticity chart. For sites where the Atterberg limits indicate borderline silt-clay behaviour, we routinely cross-reference the results with
grain-size sedimentation analysis to confirm the fines fraction, ensuring the Unified Soil Classification System designation stands up to regulatory review by the Wigan Council Building Control team.
Local context
Wigan sits at elevations ranging from 30 m in the Douglas valley bottom to over 150 m on the Pennine fringe near Billinge Hill, and this topographical spread amplifies the consequences of misclassifying a cohesive soil. A clay with a liquid limit of 45 percent may behave adequately as a subgrade on a well-drained slope in Standish, but the same material placed as engineered fill in the wetter, low-lying ground near Ince-in-Makerfield can soften within a single winter, losing bearing capacity and triggering differential settlement beneath lightly loaded foundations. The risk compounds when the Atterberg limits are interpreted without reference to the natural moisture content profile: a soil at 28 percent water content with a plastic limit of 22 percent has a liquidity index of 0.33 and is stable, whereas the same soil at 32 percent water content (liquidity index 0.55) approaches a soft consistency that the standard penetration test alone may not flag until the sampler reaches depth. Our laboratory reports always include the liquidity index alongside the Atterberg limits for every sample where the in-situ moisture content is provided, because the difference between a stiff and a soft clay in Wigan's glacial till sequence often lies in a water content variation of less than five percent.
Reference standards
BS 1377-2:1990 — Methods of test for soils for civil engineering purposes: Classification tests, BS EN ISO 17892-12:2018 — Geotechnical investigation and testing: Laboratory testing of soil. Determination of liquid and plastic limits, Eurocode 7 (BS EN 1997-2:2007) — Ground investigation and testing, Section 5.2 classification tests, BS 8004:2015 — Code of practice for foundations, Annex B: Volume change potential from plasticity index, ASTM D4318-17e1 — Standard Test Methods for Liquid Limit, Plastic Limit, and Plasticity Index of Soils (for international project comparability)
Quick answers
What is the difference between the Casagrande cup and the cone penetrometer method for liquid limit, and which one does your Wigan laboratory use?
The Casagrande cup (BS 1377-2:1990 clause 4.2) determines the liquid limit by measuring the water content at which a standard groove closes over 13 mm after 25 blows in a mechanically operated cup. The cone penetrometer method (BS 1377-2:1990 clause 4.3) uses an 80 g, 30-degree cone and defines the liquid limit as the water content corresponding to a 20 mm penetration, determined from a four-point linear regression. Our Wigan laboratory uses the cone penetrometer as the primary method because it is operator-independent, more reproducible, and recommended by Eurocode 7 for fine soils. We can run the Casagrande cup upon request for projects requiring correlation with historical site investigation data, but we always report which method was used to avoid misinterpretation.
How much does Atterberg limits testing cost for a Wigan site investigation?
Atterberg limits testing in our Wigan laboratory typically ranges from £40 to £80 per sample, depending on whether you require the full suite (liquid limit, plastic limit, plasticity index, and linear shrinkage) or a subset of these determinations. The price includes sample preparation, wet sieving through the 425 μm sieve, the test procedures themselves, and the certified report. For multi-sample projects, we can provide a discounted rate; contact the laboratory with your sample count and turnaround requirements for a firm quotation.
How many Atterberg limits samples do I need for a housing development ground investigation in Wigan?
The number of Atterberg limits samples depends on the site area and the variability of the superficial deposits. For a typical residential development plot in Wigan, we recommend a minimum of one Atterberg limits determination per distinct stratum encountered in each exploratory hole, with additional samples at the proposed foundation depth. The NHBC Standards Chapter 4.2 suggest at least one classification test per 2 m of borehole depth in cohesive strata. For sites underlain by the glacial till and Middle Coal Measures clays common across the borough, the plasticity can shift significantly over short vertical distances, so sampling at 1.0 to 1.5 m intervals in the upper 5 m is prudent. Our laboratory can advise on a cost-effective sampling schedule once the preliminary borehole logs are available.
What do the Atterberg limits tell me about shrink-swell risk on my Wigan site?
The plasticity index derived from the Atterberg limits is the primary indicator of volume change potential in cohesive soils. A plasticity index below 10 percent indicates low shrink-swell potential; 10 to 20 percent indicates medium potential; 20 to 40 percent indicates high potential; and above 40 percent indicates very high potential, per BRE Digest 240 and the NHBC Standards. In Wigan, the weathered Middle Coal Measures clays and the Manchester Marl deposits frequently fall into the medium-to-high categories, which has direct implications for foundation depth and the need for clayboard void formers or suspended floor construction. The liquid limit alone is not sufficient for this assessment: a soil with a high liquid limit but a correspondingly high plastic limit may have a moderate plasticity index and lower heave risk than the liquid limit would suggest. Our reports include the BRE volume change potential classification for every sample tested.